bar_xScale = d3.scaleBand()
  .domain([1,2,3,4,5])
  .range([m, w - m])

bar_yScale = d3.scaleLinear()
  .domain([0, 3])
  .range([h - m, m])

bar_chart = {

  const svg = d3.select(DOM.svg(w, h))
    .attr("class", "invertable")
    .attr("lazy-load", true)

  const axis_lines = svg.append("g")
    .attr("stroke", "black")
    .attr("fill", "none")

  const bars = svg.append("g")
    .attr("fill", "black")
    .attr("stroke", "none")

  bars.selectAll("rect")
    .data(bar_data)
    .enter()
      .append("rect")
      .attr("transform", "rotate(180)")
      .attr("transform-origin", "center center")
      .attr("x", d => bar_xScale(d.value)+2.5)
      .attr("y", m)
      .attr("width", (w-2*m)/5-5)
      .attr("height", d => d.density*(h-m*2)/3)


  svg.on('click',function(){
   bars.selectAll("rect")
    .attr("height", 0)
    .transition()
    .duration(300)
    .delay(function(d, i){return (6-i)*300})
    .attr("height", d => d.density*(h-m*2)/3);
  })


  axis_lines.selectAll("line")
    .data(line_data)
    .enter()
      .append("line")
        .attr("x1", d => d.x1)
        .attr("x2", d => d.x2)
        .attr("y1", d => d.y1)
        .attr("y2", d => d.y2)

  return svg.node();
}2|VARIABLES
Overview
Making statistics
- Where do statistics come from?
Measuring things
- How many books are red

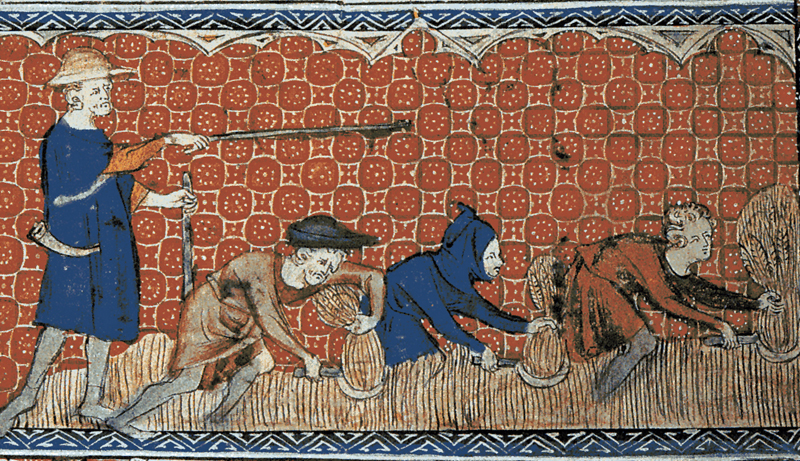
Measuring things
- How much grain is in a bushel?
Making statistics
In the United States today half of all children (35.6 million) live in a household where a parent or other adult uses tobacco, drinks heavily or uses illicit drugs1
- Other questions…
- How many students are smokers?
- Young people, narcissism, anxiety, depression 2
Measuring things
Constructs & operational definitions
- Construct: Extroversion
- Operational definition: Big 5 questions
- Construct: Intelligence
- Operational definition: IQ test
- Construct: Height
- Operational definition: How far the top of your head is from the floor according to a tape measure
Operationalizing variables
- Usually more than one way we could measure & record data
- Result in different types of data, and potentially different applicable analyses
- How to decide on operational definition?
- Aspects to consider:
- Type of variable (discrete / continuous)
- Scale of measurement (nominal / ordinal / interval / ratio)
- Aspects to consider:
Types of variable
- Discrete
- Count as whole numbers
- Separate, indivisible categories
- No values exist between neighboring categories
- E.g. number of children/cats/tvs; positive cases; hospital admissions
- Continuous
- Can be measured with decimals
- Has infinite number of possible values
- Every interval is divisible into infinite number of parts
- E.g. height, time, temperature
xScale = d3.scaleLinear()
  .domain([-3, 3])
  .range([margins.left, w - m])

yScale = d3.scaleLinear()
  .domain([0, 0.4])
  .range([h - m, m])

smooth_curve = {
  const svg_curve = d3.select(DOM.svg(w, h))
    .attr("class", "invertable");

  const axis_lines = svg_curve.append("g")
    .attr("stroke", "black")
    .attr("fill", "none")

  var p = svg_curve.append("path")
    .datum(curve_data)
    .attr("stroke", "black")
    .attr("stroke-width", 2)
    .attr("fill", "none")
    .attr("d", line)

  var totalLength = p.node().getTotalLength();

  svg_curve.on("click", function(){
    p.transition()
      .duration(0)
      .attr("stroke-dasharray", totalLength + " " + totalLength)
      .attr("stroke-dashoffset", totalLength)
      .transition()
      .duration(2000)
      .attr("stroke-dashoffset", 0)})

  axis_lines.selectAll("line")
    .data(line_data)
    .enter()
      .append("line")
        .attr("x1", d => d.x1)
        .attr("x2", d => d.x2)
        .attr("y1", d => d.y1)
        .attr("y2", d => d.y2)

  return svg_curve.node();
}Scales of measurement
| Scale | Characteristics | Examples |
|---|---|---|
| Nominal | Named categories No quantitative distinctions |
Gender Eye color Experimental condition |
| Ordinal | Ordered categories Indicates direction, but not size of difference |
Rank Clothing sizes Olympic medals |
| Interval | Ordered categories Equal intervals between categories Arbitrary or absent zero point |
Temperature (Celcius/Fahrenheit) Golf scores |
| Ratio | Ordered categories Equal interval between categories Absolute zero point |
Temperature (Kelvin) Number of correct answers Response time |
Likert scales
What is your current level of happiness?
- A lot less than usual
- A little less than usual
- About average
- A little more than usual
- A lot more than usual
Barry, D. (2017). Do not use averages with Likert scale data. https://bookdown.org/Rmadillo/likert/
Populations & samples
Draw sample, make inference
Terminology
- Populations
- Population parameters
- Usually Greek symbols
- e.g. \(\mu\); \(N\)
- Inferential statistics
- Samples
- Sample statistics
- Usually letters
- e.g. \(M\); \(n\)
- Descriptive statistics
Learning checks
- A tax form asks people to identify their
- Age
- Annual income
- Number of dependents
- Social security number
- For each variable…
- Identify the scale of measurement that probably is used
- Explain whether the variable is continuous or discrete
cov = {

  const w = 1050
  const h = 525

  d3.xml('covers/02_variables.svg')
  .then(data => {
    d3.select("#cover-image").node()
      .append(data.documentElement)

    const svg = d3.select("#cover-image").select("svg")
      .attr("width", w)
      .attr("height",h)

    const clip = svg.append("clipPath").attr("id", "clip")
      .append("rect")
      .attr("x", -w*2)
      .attr("y", h*2)
      .attr("width", w*2)
      .attr("height",h*2)
      .attr("fill", "none")

    clip
      .transition().duration(3000)
      .attr("x", 0)
      .attr("y", 0)

    svg.select("polyline")
      .attr('clip-path', "url(#clip)")


    svg.selectAll(".axis-text")
      .style("opacity", 0)
      .transition().delay(1000).duration(3000).style("opacity", 1)
  });
}
cover = {
const w = 1050
const h = 525
const marginX = 105
const marginY = 45
const svg = d3.select("#cover-image")
.append("svg")
.attr("width", w)
.attr("height", h)
const lines = svg.append("g").attr("id", "axis-lines")
.attr("stroke", "black")
.attr("class", "invertable")
lines.append("line")
.attr("x1", marginX)
.attr("x2", w-marginX)
.attr("y1", h-marginY)
.attr("y2", h-marginY)
lines.append("line")
.attr("x1", marginX)
.attr("x2", marginX)
.attr("y1", h-marginY)
.attr("y2", marginY)
const labels = svg.append("g").attr("id", "axis-text")
.attr("stroke", "black")
.attr("class", "invertable")
.attr("font-family", "KaTeX_Main")
.attr("font-style", "italic")
labels.append("text")
.attr("x", w/2)
.attr("y", h - (marginY-30))
.text("x")
labels.append("text")
.attr("x", marginX-30)
.attr("y", h/2)
.text("y")
}data = {
let arr = [];
for (var i = 0; i < 150; i++) {
arr.push({
x: Math.floor(Math.random() * xmax),
y: Math.floor(Math.random() * ymax),
color: Math.floor(Math.random() * 7)
});
}
return arr;
}
width = 1050
height = 500
r = 15
xmax = 400
ymax = 100
sample_y = height - r - 1
margin = ({top: r*2, right: 10, bottom: r, left: 5});
pop = {
var sampleData = [];
const svg = d3.select("#sample-inference-container")
.append("svg").attr("id", "#sample-inference-svg")
.attr("preserveAspectRatio", "xMinYMin meet")
.attr("viewBox", "0 0 " + width + " " + height)
<!-- .attr("width", width).attr("height", height) -->
const sample = svg.append("g").attr("id", "sample-circles")
const circles = svg.append("g").attr("id", "pop-circles")
const arrowData = [{id: -1, points: [[-10,-10],[10,-10],[0,10]]},
{id: 1, points: [[-10,10],[10,10],[0,-10]]}]
let path = {
x: (width*0.5 + xmax*.5 + r),
y: (margin.top + ymax*0.5),
cy: (height - r - (margin.top + ymax*0.5)) * 0.5
};
function generateSample() {
let arr = [];
for (var i = 0; i < 10; i++) {
arr.push(Math.floor(Math.random() * 7))
}
return arr;
}
function drawNewSample() {
sampleData = generateSample();
sample.selectAll("circle").remove()
sample.selectAll("circle")
.data(sampleData)
.enter()
.append("circle")
.attr("fill", d => color(d))
.attr("stroke", "black")
.attr("r", r)
.attr("cx", function(d, i) {return (i * 41.5 + width/2 - xmax/2 + r)})
.attr("cy", 55)
.transition()
.duration(700)
.delay(function(d, i) {return i * 50})
.attr("cy", sample_y);
paths.select("#sample-path")
.attr("stroke-dasharray", len + " " + len).attr("stroke-dashoffset", len)
.transition().duration(900).attr("stroke-dashoffset", 0)
}
function animateArrow() {
arrows.select("#arrow0")
.transition().duration(200)
.attr("transform", d => "translate(" + (width/2 + 315*d.id) + " ," + (path.cy+margin.top+ymax*0.5 - 10) +") scale(2.5)")
.transition().duration(300)
.attr("transform", d => "translate(" + (width/2 + 315*d.id) + " ," + (path.cy+margin.top+ymax*0.5 - 10) +") scale(1.5)")
}
const paths = svg.append("g").attr("id", "paths")
.attr("stroke", "black")
.attr("fill", "none")
.attr("class", "invertable");
const labels = svg.append("g").attr("id", "labels")
.attr("text-anchor", "middle")
.attr("dy", "1em")
.attr("class", "invertable");
const arrows = svg.append("g")
circles.selectAll("circle")
.data(data)
.enter()
.append("circle")
.attr("fill", d => color(d.color))
.attr("stroke", "black")
.attr("r", 15)
.attr("cx", d => x(d.x))
.attr("cy", d => y(d.y))
svg.append("rect").attr("id", "population-box")
.attr("x", width/2 - xmax/2 - r)
.attr("y", margin.top - r)
.attr("width", xmax + 2*r)
.attr("height",ymax + 2*r)
.style("stroke", "black")
.style("fill", "white")
.style("fill-opacity", 0.9)
.on("mouseover", function(d){d3.select(this).style("fill-opacity", 0.1)})
.on("mouseout", function(d){d3.select(this).style("fill-opacity", 0.9)})
paths.append("path").attr("id", "inference-path")
.attr("d", "M" + path.x + " " + path.y + " q200 " + path.cy + " 0 " + (height - r - path.y))
.attr("stroke-dasharray", [5, 5])
paths.append("path").attr("id", "sample-path")
.attr("d", "M" + (path.x - xmax - 2*r) + " " + path.y + " q-200," + path.cy + " 0 " + (height - r - path.y))
var len = paths.select("#sample-path").node().getTotalLength();
arrows.selectAll("polygon")
.data(arrowData)
.enter().append("polygon")
.attr("points", d => d.points)
.attr("id", function(d,i){return "arrow" + i})
.attr("class", "invertable")
.style("fill", "black")
.attr("transform", d => "translate(" + (width/2 + 315*d.id) + " ," + (path.cy+margin.top+ymax*0.5 - 10) +") scale(1.5)")
svg.select("#arrow0")
.style("touch-action", "manipulation")
.on("mouseover", animateArrow)
.on("click", drawNewSample)
labels.append("text").attr("id", "population-label")
.text("POPULATION")
.attr("x", width/2)
.attr("y", margin.top + ymax + 2*r + 20)
labels.append("text").attr("id", "sample-label")
.text("SAMPLE")
.attr("x", width/2)
.attr("y", sample_y - r - 10)
drawNewSample();
return svg.node();
}
x = d3.scaleLinear()
.domain([0, xmax])
.range([width/2 - xmax/2, width/2 + xmax/2])
y = d3.scaleLinear()
.domain([0, ymax])
.range([margin.top + ymax, margin.top])
color = d3.scaleOrdinal().
domain(data.map(d => d.color))
.range(d3.schemeSet3);